🧭 トレンドダッシュボードの解読:強気、弱気、中立
ログインすると ウィスバー, まず最初に目にするのは トレンドダッシュボード.
これは、市場の動向を一目で把握できるコントロールパネルです。 今すぐ チャートを読んだり、推測したりする必要はありません。😎
トレンドダッシュボードには通常、3つの主要な状態が表示されます。
- 🟢 強気
- 🔴 弱気
- 🟡 中性 (またはホールド)
それでは、それぞれの用語の意味と使い方を詳しく見ていきましょう。.
🟢 強気 – 市場は成長モードにある
トレンドダッシュボードに 強気, つまり、WhisberのAIが以下のことを検出したということです。
- ポジティブな勢い
- 買い圧力の高まり
- 価格上昇継続の可能性が高い
強気モードでできること:
- 探す エントリーの機会
- 続けて 既存のポジションを保持する
- 考慮する スケーリング (長期的な傾向も一致する場合)
💡 プロのヒント: 長期と短期の両方 = 最強のセットアップ。.
🔴弱気 – 市場は保護モード
ダッシュボードが 弱気, AIが拾い上げたもの:
- 売り圧力
- 弱体化傾向構造
- さらなる下落の可能性
弱気モードでできること:
- 資本を守る💰
- 避ける FOMO 購入する
- 弱いポジションで利益確定
- 次の上昇トレンドのシグナルを待つ
ここでWhisberが役立ちます 感情的な間違いを避ける ―株価の下落が本物かどうかを推測する必要はありません。ダッシュボードが教えてくれます。.
🟡 中立/ホールド – 市場の見通しは不透明
市場は必ずしも大きく上昇または下落するとは限らず、横ばいの動きをしたり、勢いがまちまちだったりすることもある。.
その時ダッシュボードに表示 中性 (または 所有).
これはつまり:
- 現時点では明確な優位性はない
- 無理な取引はしないでください
- 良い時期です 観察する、反応しない
ニュートラルモードでできること:
- 辛抱強く待ちましょう🧘♂️
- 次の明確な信号をお待ちください
- 過剰な取引は避ける
中立という状態は過小評価されている。それは、不必要な損失からあなたを救ってくれる状態なのだ。.
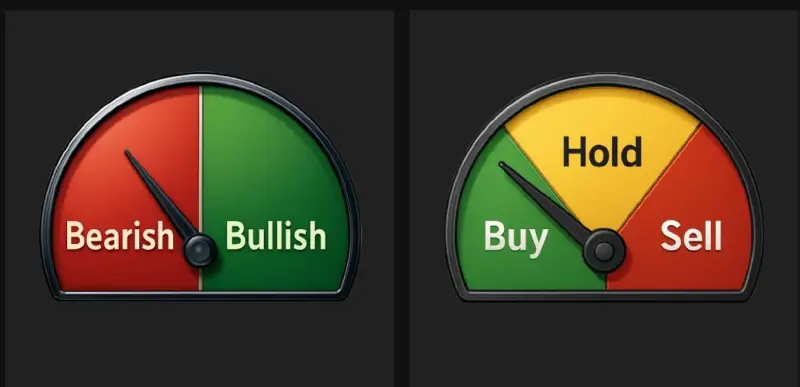
🖼 信号の発生源
あなたのスクリーンショットには、次のようなものが表示されています。
- ✅ A ゲージ 強気/弱気を指し示す
- ✅ A 購入 / 保有 / 売却 スタイルメーター
- ✅ A ヒートマップ 過去の信号を表示
これらは、同じAIの判断を視覚的に示すさまざまな方法です。
- ゲージ=現在の気分
- ヒートマップ=時間の経過に伴う挙動
- 推奨される行動=その情報を使って何をすべきか
トレーダーやチャート分析の専門家でなくても、3秒で市場の動向を読み取ることができます。⏱
🧠 ダッシュボードを実際に活用する方法
- まずはトレンドをチェックしましょう → 強気、弱気
- あなたのプランに合わせてください → 入場中ですか、待機中ですか、それともお待ち中ですか?
- AIの提案に従う → ソーシャルメディアに流されて、流行に逆行してはいけません
- 長期トレンドと組み合わせる → 長期的に弱気だが短期的に強気であれば、それは単なる反発かもしれない
✅ なぜこれが重要なのか
ほとんどの人が仮想通貨で損をするのは、 に対して トレンドやトレード 明確な傾向は見られない.
トレンドダッシュボードがその問題を解決します。.
それはあなたに 瞬時の明瞭さ だから、こう尋ねることができます。
“「今が実際に取引するのに良い時期なのか…それとも待つべきなのか?」”
これがWhisberでより賢く取引する方法です。💚