⚡ Understanding the Short-Term Trend
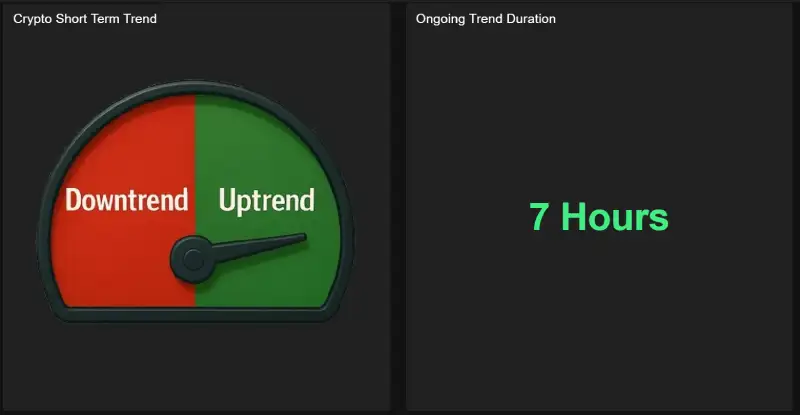
Tendance à court terme tracks hour-to-hour momentum so you can time entries/exits without staring at charts all day. The gauge tells you the current state (🔴 Downtrend / 🟢 Uptrend) and the duration counter shows how long the current move has lasted. The heatmap gives you the recent flip history so you can distinguish true turns from noise.
It’s the perfect tool for traders who want to know when momentum is shifting so they can react early — without panic, hype, or guessing.
📟 AI Trend Meters: Your Instant View
Whisber also provides clear visual meters to simplify complex data:
- Downtrend → Uptrend Gauge:
Instantly shows whether short-term sentiment has flipped bullish or bearish. - Ongoing Trend Duration:
Displays how long the current trend has lasted — e.g., “7 Hours” of confirmed momentum.
How to use it
- Very short duration (e.g., <1–2h) → likely choppy; wait for confirmation.
- Uptrend + growing duration → momentum is building; consider entries/add-ons with your risk rules.
- Downtrend + growing duration → avoid longs or tighten risk; consider hedges/exits.
🧩 How to Read the Short-Term History Chart
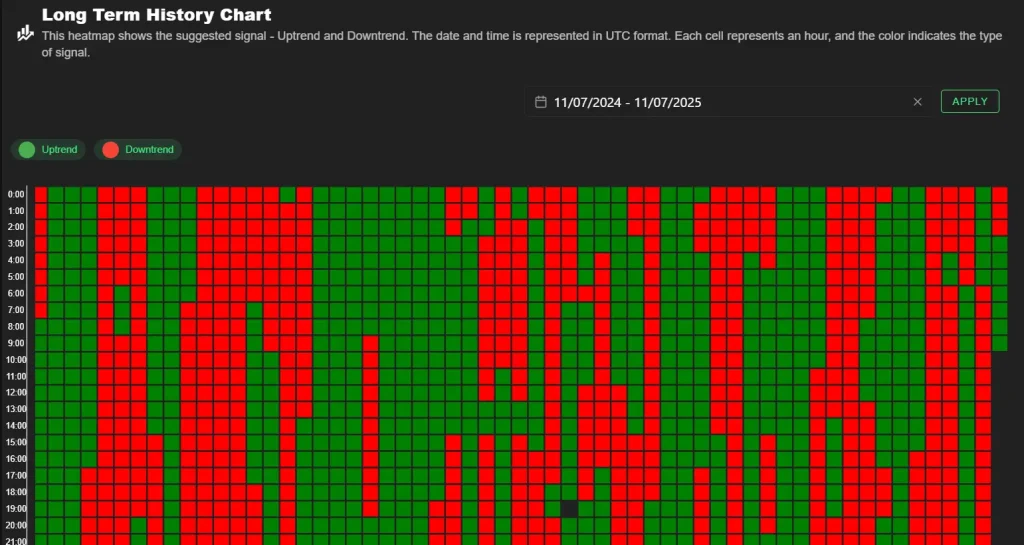
This colorful heatmap represents the Short-Term History — a visual timeline of how market direction has changed hour by hour.
- 🟢 Tendance à la hausse : Market momentum is rising — strength building, prices likely pushing higher.
- 🔴 Tendance baissière : Market losing steam — potential pullbacks or sell pressure increasing.
Each square = 1 hour, allowing you to see how often trends shifted and when they started gaining strength. (Time is in UTC)
You can filter by date (top right) to zoom in on recent activity.
👉 A long stretch of green means consistent buying pressure.
👉 A dominant red zone means bearish momentum — time to be cautious or protect profits.
🔍 What the Short-Term Trend Tells You
Le Tendance à court terme focuses on shorter intervals, showing whether the current market momentum is Uptrend (🟢) ou Downtrend (🔴).
Each signal is AI-driven, meaning it’s based on real-time data patterns — not human emotion.
The goal?
To help you catch smaller market swings while staying aligned with the overall trend.
⚙️ How Whisber’s AI Detects Short-Term Trends
Whisber’s algorithm continuously analyzes:
📊 Real-time price volatility
💰 Market volume and liquidity
🧠 Pattern recognition from historical data
📈 Sudden momentum shifts
This ensures each “Uptrend” or “Downtrend” signal reflects the true pulse of the market, not random fluctuations.
💡 How to Use It
- Combine It with the Long-Term Trend:
- When both are 🟢 → Strong confirmation of a bullish move.
- When Long-Term is 🟢 but Short-Term turns 🔴 → Possible pullback; wait for confirmation.
- Watch the Trend Duration:
- Short-Term Trend (1–3 hours) = volatility; don’t rush.
- Longer durations (6+ hours) = stronger, more reliable signals.
- Stay Emotion-Free:
- The market moves fast — let Whisber’s data guide your timing instead of reacting to social media hype.
From signal to action (ready-to-use playbooks)
A) Momentum entry (most common)
- Wait for Tendance haussière on the gauge et at least 3–6 green squares forming a cluster on the heatmap.
- Enter with smaller size on first confirmation; add if duration continues to rise.
- Exit on Tendance baissière flip ou your stop; take profits in steps.
B) Pullback add-on
- Long bias remains Tendance haussière.
- If a brief red blip appears (<3 squares) and flips back green quickly, add a small top-up with a tight stop.
- Avoid adding during extended red clusters—wait for green to return.
C) Avoid the chop
- If the heatmap alternates every 1–2 squares, stand down ou cut position size by half until clusters reappear.
Alert setup that reduces noise
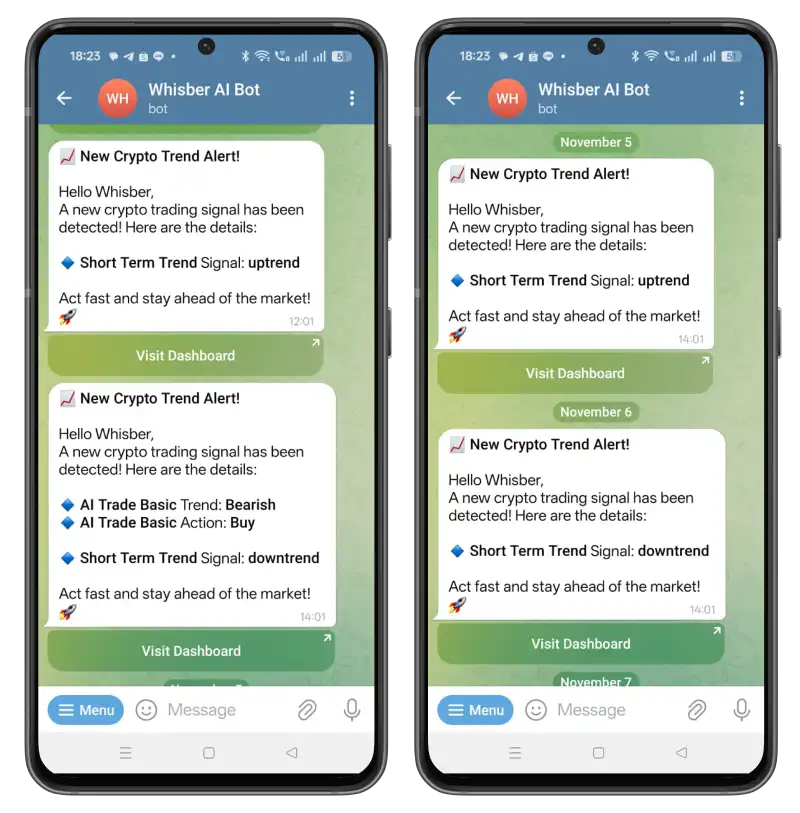
- Turn on Telegram + Email alerts for Short-Term Trend flips (Uptrend/Downtrend).
- Add quiet hours to avoid over-trading overnight (if that’s your rule).
- Start with only Premimum Subscription; later, to enable “priority” alerts if you want faster pings.
Common mistakes
- Chasing the first green square → Wait for clusters or a 2–3h duration.
- Ignoring UTC → Heatmap timestamps are UTC; align your expectations.
- Over-filtering → Start with just Uptrend/Downtrend flips; only add extra filters if you’re overwhelmed.
- Fighting Long-Term → Short-Term against Long-Term bias = lower win rate; size down or skip.
FAQ
Is Short-Term only for day traders?
Not really. Swing traders use it to time entries within a Long-Term bias.
What duration counts as “real”?
There’s no magic number, but 3–6 hours of persistence is a practical threshold for many assets.
What if duration is long (e.g., 20h)?
Momentum may be extended—consider partial profits and tighter trailing stops.
Short-Term Trends are your AI radar for quick momentum shifts.
When paired with the Long-Term Trend, they help you know:
- Check today’s Short-Term gauge for your top coins.
- Utilisez le heatmap to avoid chop and wait for clusters.
- Turn on flip alerts so you catch the next move early—without chart-watching all day.
Let Whisber handle the monitoring. You execute the plan.