📊 Understanding the Long-Term Trend
Long-term trend analysis is the heart of Whisber’s AI system.
It helps you see the bigger picture — not just where the market is today, but where it’s been heading for weeks -> even months -> sometimes up to years .
This is your roadmap for making calm, strategic crypto decisions — without reacting to daily noise.
🧠 What Is the Long-Term Trend?
A simple dial with two zones—Bearish ou Bullish, Acheter et Prise ou Vendre—and a needle pointing to the current guidance for that asset on the Tendance à long terme timeframe.
How to read it:
Bearish + Hold → Don’t add risk; wait for the next Long-Term Trend flip.
Bullish + Buy → Market trend is up; add or hold long exposure.
Bullish + Hold → Uptrend intact; don’t chase—manage existing positions.
Bearish + Sell → Downtrend dominant; reduce exposure/hedge.
Think of it as your AI compass 🧭 — showing whether you’re sailing with or against the current.
🧩 3 Levels of AI Models
Whisber includes multiple AI models working together for deeper confirmation 👇
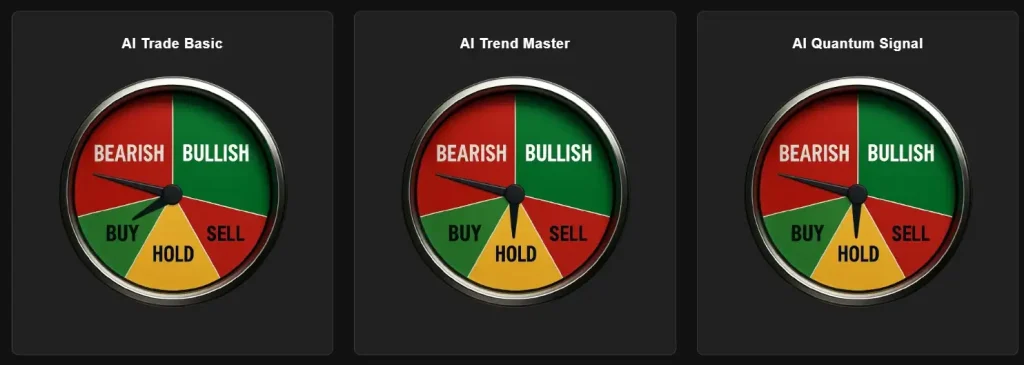
- AI Trade Basic → clear Long-Term Trend state (good for investors).
- AI Trend Master → smoother timing suggestions (enter/exit discipline).
- AI Quantum Signal → stricter noise-reduction and faster anomaly detection (power users).
When all three align bullish 🟢, it’s a strong confirmation that the uptrend is forming.
When they all show red 🔴, it’s time to stay defensive or reduce exposure.
📟 The Trend Meters
You’ll also notice AI Trend Gauges on your dashboard like these 👇
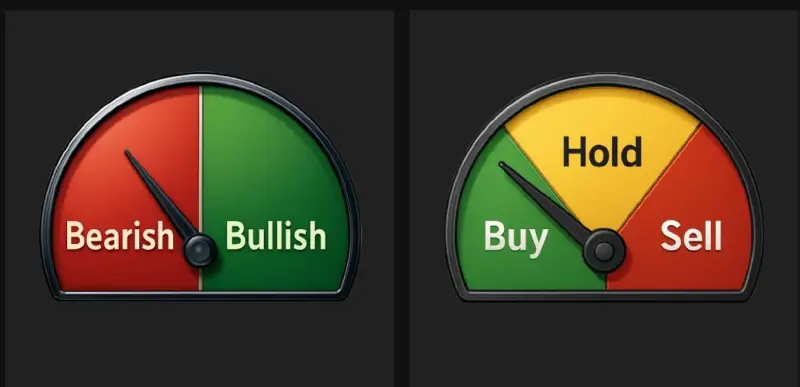
These visual dials summarize Whisber’s trend analysis into clear indicators:
- Bearish → The market is weak. Prioritize capital protection.
- Bullish → Strength building. Look for buying opportunities.
- Buy / Hold / Sell → Suggested action based on AI confidence.
Each gauge instantly shows where the market stands — no chart-reading skills required.
🔥 How to Read the Chart
Below is the Tendance à long terme History Chart, also known as the AI Trend Heatmap 👇
🟢 = Acheter
🟡 = Prise
🔴 = Vendre
Each small square represents a specific hour in time. Together, they form a timeline of Whisber’s suggested actions over months.
🖼 Long Term Trend Heatmap:
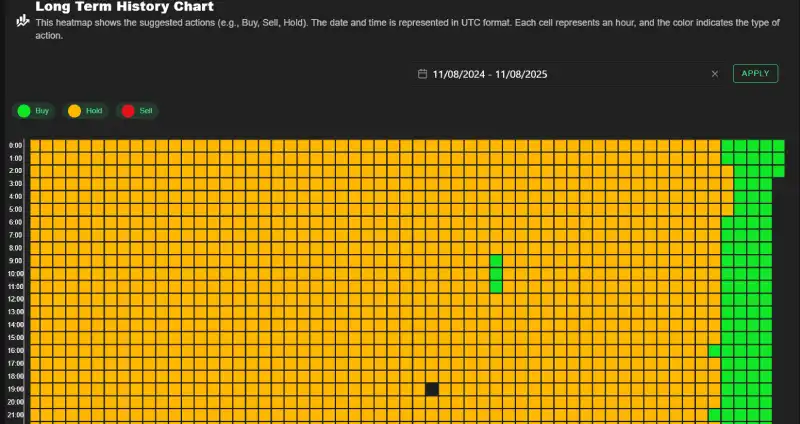
In this heatmap:
- Le red blocks (🟨) suggest Hold/Neutral — periods of market indecision or consolidation. Do not do anything.
- Le green blocks (🟩) toward the right side mark the transition into a Buy phase — signaling a potential recovery or start of a bullish wave.
- Le Yellow blocks (🟥) show a continuous Sell signal — indicating a long-term bearish period where it’s safer to preserve capital.
- Dark cells ⬛ means Muted data/ data not available. Just ignore.
🧩 Each block = 1 hour, so you can visually track how trends evolved and when the market momentum changed.
⚙️ How the AI Calculates It
Whisber’s AI scans and processes:
- 📈 Price momentum across multiple timeframes
- 💰 Market volume trends
- 🧭 Moving averages and volatility shifts
- 🧠 Historical data patterns
The result? A smoothed, data-driven long-term signal that tells you when to accumulate, hold, or sit out.
🧩 Why Long-Term Trend Matters
Many traders lose money by reacting to short-term noise.
Whisber’s Long-Term Trend helps you:
✅ Avoid emotional overtrading
✅ Focus on stable market direction
✅ Time your entries and exits better
✅ Protect capital during prolonged bearish phases
By aligning with the long-term trend, you make fewer trades — but smarter ones.
💡 Pro Tip
If the Long-Term Heatmap turns green while AI Trend Gauges confirm bullish momentum, it’s usually a strong indication of a potential trend reversal.
This is when patience pays off — let Whisber guide your timing.
From Signal to Action
Base rules (long-term investors):
- Bias: Trade with the color.
- Mostly 🟩? Favor long exposure.
- Mostly 🟥? Preserve capital or hedge.
- Entries: Add on the first solid cluster of 🟩 after a long red period.
- Exits: De-risk on the first solid cluster of 🟥 after a long green period.
- Management: During 🟨 Prise, avoid FOMO entries; manage positions (trail stops / take partial profits).
Sizing & risk (example):
- Max 3–5 core positions.
- Size 2–5% per asset; wider stops in long-term than in short-term.
- Take profits in ladders (e.g., +10% / +25% / +40%) instead of all-in/all-out.
Spotting a Major Flip
- Scan the rightmost column(s)—that’s the most recent period.
- Count clusters, not single squares. A few stray greens inside a red wall aren’t a regime change.
- Look for persistence: 24–72 consecutive hours of mostly 🟩 = meaningful shift to bull; same logic for 🟥 turning bear.
- Confirm with the gauge: Heatmap says green cluster and the gauge needle points Bullish/Buy? That’s your go signal.
In the provided heatmap, you can see a long stretch of 🟥 (sell) that transitions into a tall band of 🟩 on the far right—this is what a major long-term flip looks like.
How Long-Term and Short-Term Work Together
- Use Long-Term to set your market bias (macro direction).
- Use Short-Term to time entries inside that bias.
- Example: Long-Term turns Bullish → switch to Short-Term for entry triggers; if Short-Term dips red briefly, you wait for it to re-align green to add.
FAQ
Is the heatmap a backtest?
It’s a record of live signal states over time (hourly). Use it to understand regime duration and to avoid overreacting to short blips.
Can I just buy whenever it turns green?
Have a plan. Green suggests with-trend exposure, but you still need sizing, stops, and take-profit rules.
What if green turns back to red quickly?
That’s a false start. Wait for persistence (clusters) and confirm with the gauge before committing size. But for AI Quantum Signal , this might be happened and it is not a false signal.
Ready to use Long-Term like a pro?
- View the Long-Term Gauge for your top coins.
- Scan the heatmap for persistent clusters.
- Turn on Buy/Sell flip alerts so you never miss a regime change.
Let Whisber watch the market. You focus on following your rules.