Panel de control de Whisber
Esta guía rápida te ayuda a navegar por el Panel de control de Whisber fácilmente, ya sea que esté utilizando un de oficina o móvil dispositivo.
Cada captura de pantalla que aparece a continuación corresponde a las páginas principales con las que interactuarás durante la configuración y el uso diario.

Paso 1: Iniciar sesión / Registrarse

De oficina:
- Ingresa tu correo electrónico y contraseña o inicia sesión con Google.
- Utiliza la opción "Recordarme" para mantener la sesión iniciada.
Móvil:
- Toca el ☰ menú Icono para abrir el panel de inicio de sesión.
- Las mismas funciones que en la versión de escritorio, optimizadas para el desplazamiento vertical.
Paso 2: Elige tu plan de suscripción

Vista de escritorio:
- Comparar Pasatiempo, Básico, y De primera calidad planos uno al lado del otro.
- Hacer clic Seleccionar paquete para activar tu plan.
- Método de pago = Tarjeta de crédito
Vista móvil:
- Desliza el dedo verticalmente para ver los planos.
- Toca para ver más detalles o confirmar el plan que has seleccionado.
Paso 3: Conectar notificaciones
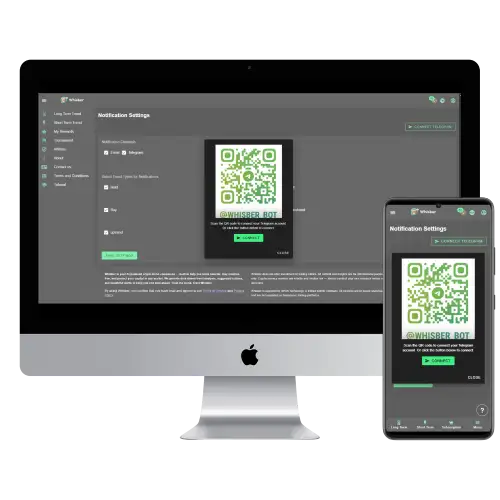
De oficina:
- Escanear el Código QR o haga clic Conéctate a Telegram.
- Vincularás tu Telegram a @Whisber_Bot para recibir alertas instantáneas.
Móvil:
- Grifo Conéctate a Telegram, Se abrirá directamente en la aplicación Telegram.
- Confirma la conexión con el bot.
Paso 4: Configuración de notificaciones

De oficina:
- Elige tu canales de alerta (Correo electrónico, Telegram). (Solo para usuarios Premium)
- Marque las señales de las que desea recibir notificaciones: 🟢 Comprar, 🟡 Mantener, 🔴 Vender, ⬆️ Tendencia alcista, ⬇️ Tendencia bajista.
- Hacer clic Guardar configuración.
Móvil:
- Desplácese hacia abajo para ajustar las preferencias fácilmente.
- Pulsa “Guardar” en la parte inferior: todos los ajustes se sincronizarán automáticamente.
Paso 5: Panel de control de tendencias a corto plazo de Whisber

De oficina:
- El indicador izquierdo muestra Tendencia alcista vs. tendencia bajista.
- El lado derecho muestra Duración de la tendencia (cuánto tiempo ha durado la señal).
- Ideal para operadores intradía o para monitorización por horas.
Móvil:
- Los indicadores se apilan verticalmente para una mejor visibilidad.
- Desliza hacia abajo para actualizar y comprobar el estado más reciente.
Paso 6: Panel de control de tendencias a largo plazo de Whisber

De oficina:
- Pantalla de dos medidores:
- Dirección del mercado: Bajista o alcista.
- Acción sugerida: Comprar / Mantener / Vender.
- Útil para la planificación estratégica semanal o mensual.
Móvil:
- El mismo diseño, redimensionado para desplazarse con una sola mano.
- Perfecto para consultar el estado de las tendencias sobre la marcha.
Paso 7: Gráfico de historial de tendencias


De oficina:
- Mapa de calor codificado por colores (🟢 = Tendencia alcista, 🔴 = Tendencia bajista, 🟡 = Mantener).
- Cada celda = 1 hora de datos.
- Ideal para visualizar las fases históricas del mercado.
Móvil:
- Desliza el dedo horizontalmente para ver el historial.
- Pulsa y amplía para ver con mayor claridad las tendencias recientes.
✅ Consejos para ambos dispositivos
- 🔔 Habilitar notificaciones — para que nunca te pierdas una alerta de compra/venta.
- 🧭 Utilice el corto plazo para la planificación temporal y el largo plazo para la planificación estratégica.
- 💚 Confía en el panel de tendencias — Se actualiza automáticamente todos los días.