Whisber Dashboard
This quick guide helps you navigate the Whisber Dashboard easily — whether you’re using a desktop or mobile device.
Each screenshot below corresponds to the main pages you’ll interact with during setup and daily use.

Step 1: Login / Sign Up

Desktop:
- Enter your email and password or sign in with Google.
- Use “Remember Me” to stay logged in.
Mobile:
- Tap the ☰ menu icon to open the login panel.
- Same functions as desktop — optimized for vertical scrolling.
Step 2: Choose Your Subscription Plan

Desktop View:
- Compare Hobby, Basic, and Premium plans side by side.
- Click Select Package to activate your plan.
- Payment Method = Credit Card
Mobile View:
- Swipe vertically to view plans.
- Tap to expand details or confirm your plan selection.
Step 3: Connect Notifications
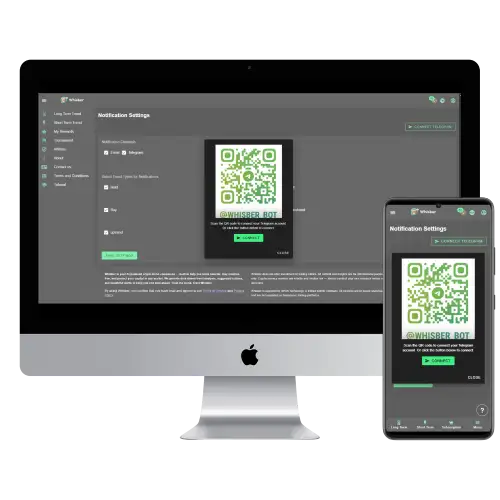
Desktop:
- Scan the QR code or click Connect Telegram.
- You’ll link your Telegram to @Whisber_Bot for instant alerts.
Mobile:
- Tap Connect Telegram, it will open directly in the Telegram app.
- Confirm the bot connection.
Step 4: Notification Settings

Desktop:
- Choose your alert channels (Email, Telegram). (Premium users only)
- Tick which signals you want to be notified of: 🟢 Buy, 🟡 Hold, 🔴 Sell, ⬆️ Uptrend, ⬇️ Downtrend.
- Click Save Settings.
Mobile:
- Scroll to adjust preferences easily.
- Tap “Save” at the bottom — all settings sync automatically.
Step 5: Short-Term Trend Whisber Dashboard

Desktop:
- Left gauge shows Uptrend vs Downtrend.
- Right side shows Trend Duration (how long the signal has lasted).
- Ideal for day traders or hourly monitoring.
Mobile:
- The gauges stack vertically for better visibility.
- Swipe down to refresh and check the latest status.
Step 6: Long-Term Trend Whisber Dashboard

Desktop:
- Two meters display:
- Market Direction: Bearish or Bullish.
- Suggested Action: Buy / Hold / Sell.
- Useful for weekly or monthly strategy planning.
Mobile:
- Same layout, resized for one-hand scrolling.
- Perfect for checking trend status on the go.
Step 7: Trend History Chart


Desktop:
- Color-coded heatmap (🟢 = Uptrend, 🔴 = Downtrend, 🟡 = Hold).
- Each cell = 1 hour of data.
- Great for visualizing historical market phases.
Mobile:
- Swipe horizontally to browse history.
- Tap and zoom for clearer view of recent trend patterns.
✅ Tips for Both Devices
- 🔔 Enable notifications — so you never miss a Buy/Sell alert.
- 🧭 Use Short-Term for timing, Long-Term for direction.
- 💚 Trust the trend dashboard — it updates automatically every day.