The Short-Term Trend is where things start to move fast — and where most traders either win big or make emotional mistakes.
At Whisber, our goal is to help you stay calm, confident, and data-driven by showing you what’s really happening behind every market swing. 📊
Here’s how to read and use your short-term trend signals effectively 👇
🔍 What Short-Term Trend Signals Show
Whisber’s AI analyzes market data hour by hour to detect momentum changes — shifts in price strength, volatility, and sentiment.
Each update gives you a clear signal:
- 🟢 Uptrend: Buyers are in control, market gaining strength.
- 🔴 Downtrend: Sellers are dominating, momentum weakening.
- ⚪ Transition: Market is preparing for a potential change.
These signals are your early warning system — letting you spot turns before the crowd does. 🚀
🧩 The Short-Term Trend Heatmap
On your dashboard, you’ll see a colorful heatmap similar to this 👇
🟢 = Uptrend 🔴 = Downtrend
Each block represents one hour of trend data.
A long row of 🟢 blocks = strong upward momentum,
while clusters of 🔴 blocks = bearish waves or corrections.
✅ What to look for:
- Consistency: The more consecutive green or red blocks, the stronger the move.
- Switch Points: When colors change rapidly, it signals volatility — stay cautious.
This visual snapshot helps you quickly judge whether momentum is building, fading, or reversing.
📟 The Momentum Gauges
Your Short-Term Trend Meter and Trend Duration Counter work together to show:
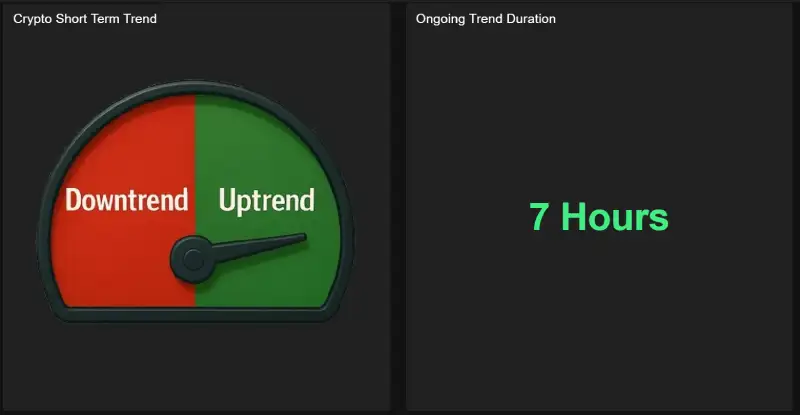
- Gauge Direction: Points toward 🟢 Uptrend or 🔴 Downtrend
- Trend Duration: Shows how long the current phase has lasted (e.g., 7 hours of uptrend)
💡 If the uptrend has lasted several hours with steady momentum, it may indicate a reliable move rather than a quick spike.
⚙️ How AI Measures Momentum
Whisber’s engine scans thousands of live data points:
- 📈 Price acceleration and slope of movement
- 💰 Trading volume changes
- 📊 Volatility spikes
- 🧠 Pattern recognition from historical market behavior
These insights combine into a clear AI reading that updates continuously — no manual charting needed.
🎯 How to Use Short-Term Signals
- Align with the Long-Term Trend
- When both long- and short-term show 🟢, momentum is strong — consider entering.
- When short-term 🔴 but long-term 🟢, it’s likely a pullback — wait for recovery.
- Use Duration for Timing
- Early signals (1–3 hours) may still be unstable.
- Longer runs (6+ hours) show stronger conviction.
- Stay Emotion-Free
- Don’t chase quick flips. Let Whisber’s AI confirm before acting.